Category Archives: Energy and Climate Change

News and articles on climate change, vehicle pollution, and renewable energy.

Tesla In-Car App To Soon Offer Solar Roof & Powerwall Monitoring

Soon Tesla owners will be able to check solar roof and powerwall status, as well as manage settings via an in-car app.

Elon musk went on a bit of a Tweetstorm again recently, and out of it came some new information. Being that Musk believes that eventually most customers will also go solar, and invest in a Powerwall, the company has already taken steps to further integrate the products.

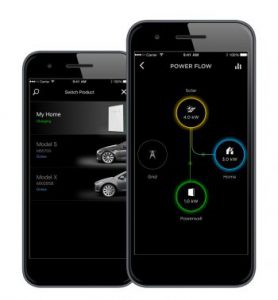
The updated mobile app allows those with solar roofs and Powerwalls to check power status and adjust settings via their devices. This is simply on par with many of the new home management systems in which users can mobily adjust their thermostat, engage or disengage alarms, monitor energy usage, etc.

Basically, with access to the app, Tesla owners can check how their home system is using power. Is the power coming from the Powerwall, or the solar system, or from the local grid? This way, you can see exactly what is happening at any given time.

We recently reported about YouTuber, DeRage, tapping into Tesla’s API to create a program that shows vehicle and home data all in once place. He used a program called Splunk to design dashboards for such information.

Mobile App now shows Powerwall and Solar energy flow

Soon, if you own a Tesla vehicle and a home solar system, you will be able to do this yourself, using the car’s touch screen. Being able to see vehicle energy consumption, along with home energy consumption, and especially being able to tie them together, will be a helpful tool. If you happen to have a non-Tesla home system, something like DeRage designed would be the next best thing.

This is just another way for Tesla and Musk to further tie all products together, in hopes that consumers will come to Tesla for all their needs, instead of a third party.

Source: InsideEVs

Renault Enters Smart Home Energy Market

Renault has launched a smart energy system, which looks to make use of second-life EV batteries for domestic and commercial energy storage.

Partnering with Powervault, the system will undergo trials with customers who already have solar panels installed. A total of 50 units will be involved in the trial, which will involve eligible M&S Energy customers along with social housing tenants and schools in the South East.

The system stores energy generated by the solar panels for use when the demand is greatest. It also allows owners to charge from the grid at off-peak rates, for use during peak times.

Powervault will use batteries that have come to the end of their usable EV life from Renault, as the French manufacturer enters the home energy storage market like its group partner Nissan, and other plug-in manufacturers Tesla, BMW, and Mercedes Benz.

Nicolas Schottey, Program Director, EV batteries and infrastructures at Renault, said:

“Thanks to this home energy storage partnership with Powervault, Renault is adding a new element into its global strategy for second life batteries, which already covers a large number of usages from industrial to residential building and districts.

“The second life use not only gives additional life to electric vehicle batteries before they are recycled, but also allow consumers to save money. It’s a win-win-win: for EV owners, home-owners and the planet.”

Read more: Zap-Map

Cleaner Than Ever: Latest Numbers Show Electric Vehicle Advantage Is Growing

OAKLAND, CA (May 31, 2017)—Everywhere in the US, driving electric is cleaner than driving a typical gasoline-powered car. That’s truer now than ever before, and the advantage electric vehicles have over comparable gasoline cars is only continuing to increase.

New analysis by the Union of Concerned Scientists (UCS) shows that in 70 percent of the country, driving electric produces fewer emissions than driving a traditional gasoline car that gets 50 miles to the gallon. On average, today’s electric vehicles are as clean as gasoline cars that get 73 miles to the gallon. That’s thanks in large part to significant improvements in power generation, with more regions cutting their use of coal and increasing investment in renewable energy sources like wind and solar.

“Driving electric is one of the best choices a consumer can make to reduce emissions in their own lives,”

said David Reichmuth, senior vehicles engineer at UCS.

“As the electric vehicle market has emerged over the last five years, electric vehicles are better than a 50 mpg gasoline car for 70 percent of Americans, up from 50 percent. It’s been remarkable to see the improvements.”

Over their whole life cycle—from manufacturing to driving to disposal—electric vehicles produce half the emissions of a comparable gasoline vehicle. By far the largest share of emissions comes from driving, which is where electric vehicles have a big and growing advantage.

The new analysis is based on updated numbers on power generation from the U.S. Environmental Protection Agency, which show reduced greenhouse gas emissions from power generation in most of the country over the past five years.

“The future of driving is electric,” said Reichmuth. “We need to keep working to make sure these cars are accessible to more drivers, that we have the infrastructure to charge them, and that we continue to replace old dirty sources of power with new renewable technology.”

UCS has also updated an interactive online tool that drivers can use to learn how much cleaner different models of electric vehicles are where they live, as well as a map showing how electric vehicle emissions compare across the country.

Source: UCSUSA

Is Big Oil planning its own funeral?

The end of the Oil Age is within sight. Everyone who follows the news should be able to see this by now, although people have vastly different ideas about the timeline.

Above: Internal Combustion Engine vs. Battery Electric Vehicle (Instagram: cars217mph / gunthersahagun)

Consultancies, investment analysts and think tanks around the world produce a constant stream of predictions about the future impact of new technologies on the auto and oil industries. Despite the pundits’ painstaking perusal of primary sources, including economic data and interviews with industry insiders, their conclusions do not agree, to say the least.

The oil industry itself, along with mainstream investment banks, tends to foresee a gradual, decades-long transition. BP’s 2017 Energy Outlook predicts that electric vehicle (EV) sales will grow to a mere 6% of the global auto market by 2035 (from around 1% today). A recent report by Goldman Sachs is a bit more adventurous, predicting that pure EVs will capture 5% of the market by 2025. The US Department of Energy’s Energy Information Administration (EIA) has doubled its forecast from last year, but still predicts that EVs will account for only 8% of the US market in 2025.

Sign of the times: Emirates National Oil Company just opened the first solar-powered gas station in Dubai (Source: CleanTechnica)

Organizations of a more greenish hue are more sanguine: Greentech Media Research expects EVs to score 12% of the US market in 2025, and Bloomberg New Energy Finance predicts 35% globally by 2040. A study from the Carbon Tracker Initiative argues that EVs could capture 33% of the global market by 2035, and that reductions in battery costs

“could halt growth in global demand for oil from 2020.”

To those who follow the EV industry, none of this is really news. Lately, however, there have been signs that at least some in the oil industry are reassessing the threat to their empire, and preparing for a “peak oil” scenario that may come much sooner than they have been predicting.

Another sign of the times: RWE, Germany’s biggest gas and energy provider, just launched hundreds of electric vehicle charging stations (Source: Trustnodes)

Read more: Evannex

What difference will electric cars make to our electricity demand

Simple calculation[s] as to the impact on electricity demand as we progressively switch over to electric cars.

National Grid estimates up to 7% increase in electricity demand by 2040 for EVs

There are around 30 million cars on the road today [1]. National Grid’s Future Energy Scenarios 2016 presents 4 scenarios – in the most ambitious ‘Gone Green’ scenario there are 9.7 million electric vehicles (EV) on the roads in 2040 using an extra 24 TWh/year. Relative to current electricity demand that is an increase of 7%[2].

But the impact on peak demand will be minor, if drivers respond to time of use pricing.

However, this demand is highly unlikely to be spread evenly through the day and year. Firstly, people tend to drive more in the summer, presumably because it is considerably more pleasant than driving in the winter [3]. Fortunately our peak electricity demand is in the winter so this helps to even out the load.

Secondly, assuming time of use pricing is widely adopted drivers will try quite hard to charge their vehicles at times of the day when the electricity is cheap. Most people will have quite a lot of flexibility and during the peak time a lot of drivers are on the road anyway.

This means electric car charging will increase non-peak demand much more than peak. The chart below shows a typical January day. If electric car charging is spread over non-peak times it will start to fill in the yellow area but not impact on the peak demand. 24 TWh/year is 66 GWh/day so it could fill in just over a quarter of the yellow area.
A typical day’s UK electricity demand in January

If all cars were electric there would be more impact on peak demand

However, 66 TWh/day is from only 9.7 million electric vehicles. If we replaced all 30 million cars, it would be nearer 200 GWh/day. This does still fit into the yellow area – just – but it would be quite a challenge to ensure that there was no ‘leakage’ and it did not impact on the winter peak at all.

Read more: Blogspot

Severe Flooding, Against a Background of Wind Turbines: November 2012, Tyringham, Bucks. (Image: T. Larkum)

Scientists say the pace of sea level rise has nearly tripled since 1990

A new scientific analysis finds that the Earth’s oceans are rising nearly three times as rapidly as they were throughout most of the 20th century, one of the strongest indications yet that a much feared trend of not just sea level rise, but its acceleration, is now underway.

Severe Flooding, Against a Background of Wind Turbines: November 2012, Tyringham, Bucks. (Image: T. Larkum)
Severe Flooding, Against a Background of Wind Turbines (Image: T. Larkum)

“We have a much stronger acceleration in sea level rise than formerly thought,”

said Sönke Dangendorf, a researcher with the University of Siegen in Germany who led the study along with scientists at institutions in Spain, France, Norway and the Netherlands.

Their paper, just out in the Proceedings of the National Academy of Sciences, isn’t the first to find that the rate of rising seas is itself increasing — but it finds a bigger rate of increase than in past studies. The new paper concludes that before 1990, oceans were rising at about 1.1 millimeters per year, or just 0.43 inches per decade. From 1993 through 2012, though, it finds that they rose at 3.1 millimeters per year, or 1.22 inches per decade.

The cause, said Dangendorf, is that sea level rise throughout much of the 20th century was driven by the melting of land-based glaciers and the expansion of seawater as it warms, but sea level rise in the 21st century has now, on top of that, added in major contributions from the ice sheets of Greenland and Antarctica.

“The sea level rise is now three times as fast as before 1990,”

Dangendorf said.

Studying the changing rate of sea level rise is complicated by the fact that scientists only have a precise satellite record of its rate going back to the early 1990s. Before that, the records rely on tide gauges spread around the world in various locations.

But sea level rise varies widely in different places, due to the rising and sinking of land, large-scale gravitational effects on the waters of the globe and other local factors.

Read more: The Washington Post

Blades Being Installed on Turbine 5, Yelvertoft Wind Farm (Image: T. Larkum)

Britain’s wind turbines catch breeze of a rising industry

The sound made by 100 tonnes of steel and carbon fibre rotating 400 feet overhead is surprisingly understated. Each whoosh of the 260 foot blades spans an area the size of the London Eye and generates enough electricity to power the average British home for 24 hours.

Blades Being Installed on Turbine 5, Yelvertoft Wind Farm (Image: T. Larkum)
Onshore Wind Farm (Image: T. Larkum)

There are 32 of these 8MW turbines in the second phase of Dong Energy’s Burbo Bank wind farm spinning off the Merseyside coast.

They are the most powerful ever, dotting an area the size of almost 6,000 football pitches within the Irish Sea, each one a beacon of Britain’s global dominance in the booming offshore wind industry.

Benj Sykes, the UK boss for Dong Energy’s wind power business, predicts he may be cutting the ribbon on turbines with double this power capacity by 2024.

“If you wind the clock back four or five years, this scale of technology was considered very ambitious. Now, you can see them in reality, commercially deployed. It’s very difficult to say where we will ultimately get to,”

he says.

Wind turbines have already more than doubled their power capacity since Dong Energy constructed the first phase of Burbo Bank in 2007 with 3.7MW structures. By the mid-2020s turbines may double again and a capacity of 15MW could be spinning in Europe’s waters.

As the efficiency and power potential of each turbine increases, costs keep falling.

Read more: The Telegraph

Half the Great Barrier Reef may have died in last two years

AS MUCH as half the Great Barrier Reef may have died in the back-to-back bleachings over the past two years.

Bleaching on a coral reef in Great Barrier Reef. Picture: ARC Centre of Excellence for Coral Reef Studies/AFP

But the head of the authority in charge of the reef says the actual extent of damage is tricky to calculate because some parts are growing well.

The Great Barrier Reef Marine Park Authority believes about 30 per cent of coral, in the reef’s northern part, died last year in bleaching caused by warmer ocean waters, chairman Russell Reichelt told a Senate committee on Monday.

Surveys after this year’s bleaching are still being done but initial observations suggest 20 per cent of coral — mainly in the central area of the 344,000 sq km reef — is dead.

“Don’t think of these figures as the net amount of coral on the Barrier Reef because there are quite big movements upwards as well as downward,”

Dr Reichelt told the senators at an estimates hearing in Canberra.

The southern part of the reef had grown by about 40 per cent in recent years because it hadn’t been hit by cyclones or bleaching — but it was likely it would suffer from those in the future.

A diver examines bleaching on a coral reef on Orpheus Island. Picture: Greg Torda/AFPSource:AFP

Dr Reichelt said the bigger picture question was the coral’s resilience in the face of bleachings, tropical storms and other threats such as the crown of thorns invasions.

“It depends on the frequency of these major impacts and the concern is the frequency could well be increasing and the recovery time will be insufficient,”

he said.

“If the recovery time is very short, there won’t be a lot of coral.”

Read more: News.com.au

Miles of ice collapsing into the sea

[The NY Times] went to Antarctica to understand how changes to its vast ice sheet might affect the world.

Ice sheets flow downhill, seemingly in slow motion. Mountains funnel the ice into glaciers. And ice flowing from the land into the sea can form a floating ice shelf.

Glaciers in certain areas have been undercut by warmer ocean waters, and the flow of ice is getting faster and faster.

The acceleration is making some scientists fear that Antarctica’s ice sheet may have entered the early stages of an unstoppable disintegration.

Because the collapse of vulnerable parts of the ice sheet could raise the sea level dramatically, the continued existence of the world’s great coastal cities — Miami, New York, Shanghai and many more — is tied to Antarctica’s fate.

Four New York Times journalists joined a Columbia University team in Antarctica late last year to fly across the world’s largest chunk of floating ice in an American military cargo plane loaded with the latest scientific gear.
Inside the cargo hold, an engineer with a shock of white hair directed younger scientists as they threw switches. Gravity meters jumped to life. Radar pulses and laser beams fired toward the ice below.

On computer screens inside the plane, in ghostly traces of data, the broad white surface of the Ross Ice Shelf began to yield the secrets hiding beneath.

“We are 9,000 miles from New York. But we are connected by the ocean.”

said the white-haired engineer, Nicholas Frearson of Columbia.

Nicholas Frearson, at left, in the cargo hold of an LC-130 Hercules.

A rapid disintegration of Antarctica might, in the worst case, cause the sea to rise so fast that tens of millions of coastal refugees would have to flee inland, potentially straining societies to the breaking point. Climate scientists used to regard that scenario as fit only for Hollywood disaster scripts. But these days, they cannot rule it out with any great confidence.

Yet as they try to determine how serious the situation is, the scientists confront a frustrating lack of information.

Recent computer forecasts suggest that if greenhouse gas emissions continue at a high level, parts of Antarctica could break up rapidly, causing the ocean to rise six feet or more by the end of this century. That is double the maximum increase that an international climate panel projected only four years ago.

Read more: NY Times

Severe Flooding, Against a Background of Wind Turbines: November 2012, Tyringham, Bucks. (Image: T. Larkum)

Arctic stronghold of world’s seeds flooded after permafrost melts

No seeds were lost but the ability of the rock vault to provide failsafe protection against all disasters is now threatened by climate change

Severe Flooding, Against a Background of Wind Turbines: November 2012, Tyringham, Bucks. (Image: T. Larkum)

It was designed as an impregnable deep-freeze to protect the world’s most precious seeds from any global disaster and ensure humanity’s food supply forever. But the Global Seed Vault, buried in a mountain deep inside the Arctic circle, has been breached after global warming produced extraordinary temperatures over the winter, sending meltwater gushing into the entrance tunnel.

The vault is on the Norwegian island of Spitsbergen and contains almost a million packets of seeds, each a variety of an important food crop. When it was opened in 2008, the deep permafrost through which the vault was sunk was expected to provide

“failsafe” protection against “the challenge of natural or man-made disasters”.

But soaring temperatures in the Arctic at the end of the world’s hottest ever recorded year led to melting and heavy rain, when light snow should have been falling.

“It was not in our plans to think that the permafrost would not be there and that it would experience extreme weather like that,”

said Hege Njaa Aschim, from the Norwegian government, which owns the vault.

“A lot of water went into the start of the tunnel and then it froze to ice, so it was like a glacier when you went in,”

she told the Guardian. Fortunately, the meltwater did not reach the vault itself, the ice has been hacked out, and the precious seeds remain safe for now at the required storage temperature of -18C.

Read more: The Guardian